

European dividend ETFs can provide regular cash distributions, but the best starting point is the portfolio behind those payments. Compare what a fund owns, how concentrated it is, its costs and distribution record before choosing by headline yield.
For investors who want spendable income, a distributing UCITS share class is the relevant option. For someone building wealth without needing cash payments, a broad-market ETF deserves comparison before adding a dividend strategy.
Quick answer: Start with eurozone funds if you specifically want eurozone dividend exposure, broader European funds if you want a wider regional allocation, and global funds if your income portfolio should span several regions. A higher distribution yield alone does not make one fund the better investment.
Prepared for 2027. Fund information and tax sources were checked on 27 September 2026 using the latest available information from the linked providers. Future distributions and changes to 2027 tax rules are not assumed.
European dividend ETFs compared
These five funds represent different approaches to European dividend investing. They are comparison candidates, not a performance ranking.
| Fund and example ticker | ISIN | Geographic focus | Annual TER | Distribution schedule |
|---|---|---|---|---|
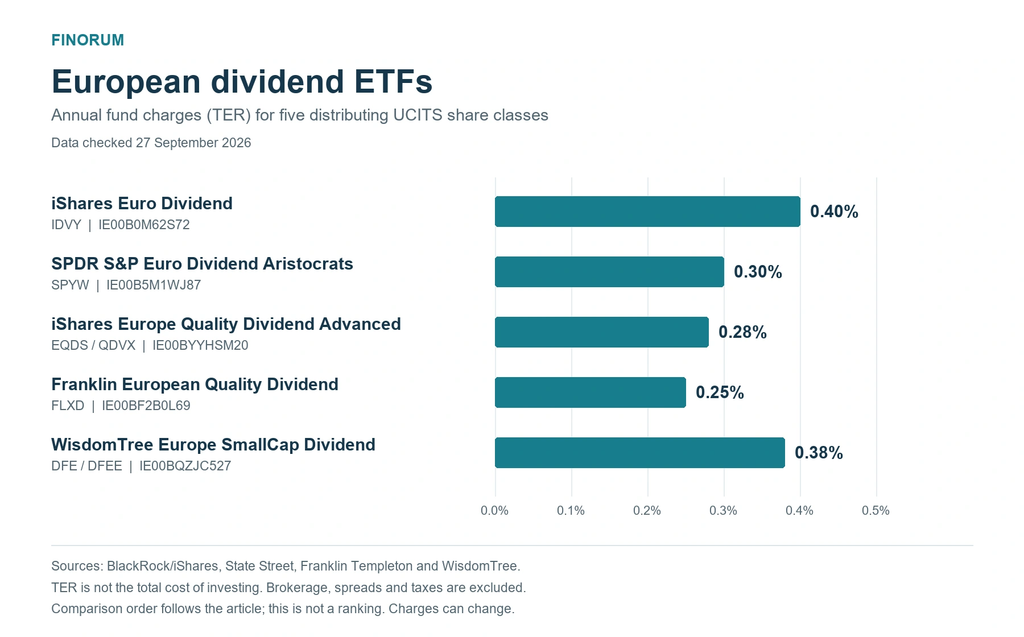
| iShares Euro Dividend UCITS ETF — IDVY | IE00B0M62S72 | Eurozone | 0.40% | Quarterly |
| State Street SPDR S&P Euro Dividend Aristocrats UCITS ETF — SPYW | IE00B5M1WJ87 | Eurozone | 0.30% | Semi-annually |
| iShares MSCI Europe Quality Dividend Advanced UCITS ETF — EQDS/QDVX | IE00BYYHSM20 | Developed Europe | 0.28% | Quarterly |
| Franklin European Quality Dividend UCITS ETF — FLXD | IE00BF2B0L69 | Developed Europe | 0.25% | Quarterly |
| WisdomTree Europe SmallCap Dividend UCITS ETF — DFE/DFEE | IE00BQZJC527 | European small caps | 0.38% | Semi-annually |
All share classes shown are distributing UCITS ETFs. TER excludes brokerage and does not capture every investment cost. Tickers and trading currencies differ between exchanges. Confirm the ISIN, current documentation and availability through your broker.
What each dividend ETF actually does
The best European dividend ETFs for your shortlist should serve a defined purpose. Two funds with different names can still leave you exposed to many of the same companies and sectors.
IDVY: concentrated eurozone dividend exposure
The iShares Euro Dividend UCITS ETF tracks a 30-stock eurozone dividend index.
That concentration is its defining feature. It provides a targeted allocation to dividend-paying companies, with less company-level breadth than a broad European market fund. Dividend selection can also produce substantial sector tilts.
Consider IDVY when you specifically want eurozone dividend exposure. If you already own another European income fund, compare the largest holdings before assuming that adding IDVY increases diversification.
SPYW: a dividend-history requirement
The State Street SPDR S&P Euro Dividend Aristocrats UCITS ETF tracks an index selecting 40 high-yielding eurozone companies that have maintained stable or increasing dividends for at least ten consecutive years.
The historical requirement adds a selection rule beyond current yield. It does not guarantee future payments: a company with a long dividend record can still cut its distribution.
Its semi-annual schedule also matters if you intend to spend the income. Two payments a year require different cash planning from quarterly distributions.
iShares Europe Quality Dividend Advanced: a broader European universe
This fund combines dividend selection with quality and sustainability criteria through the MSCI Europe High Dividend Yield Advanced Select Index.
The issuer reported 70 holdings in September 2026. Its wider geographic universe and screening rules make it a different portfolio from a concentrated eurozone dividend fund.
Read the criteria and inspect the resulting holdings. “Quality” describes part of the selection process; it is not a promise that the fund will suffer smaller losses in every downturn.
Franklin European Quality Dividend: dividend and quality screening
The Franklin European Quality Dividend UCITS ETF tracks the LibertyQ European Dividend Index, selecting developed European companies using dividend and quality criteria.
Its 0.25% TER is the lowest among the five candidates. That is useful when comparing costs, but the underlying portfolio remains the main decision. Check its holdings and index rules before choosing it over a fund with different exposure.
WisdomTree Europe SmallCap Dividend: smaller companies, different risks
The WisdomTree Europe SmallCap Dividend UCITS ETF targets smaller European dividend-paying businesses, with additional risk and ESG screens.
It can introduce company-size exposure that a portfolio dominated by large multinational businesses lacks. Smaller companies, however, can face more difficult financing conditions and less liquid share trading.
For someone choosing a first and only equity fund, this specialisation deserves careful comparison with a broader market portfolio.
Finorum’s guide to the best UCITS ETFs in Europe provides a wider framework for comparing fund structures and investment exposure.
European dividend ETFs vs global dividend ETFs
“European dividend ETF” can mean a fund investing in European companies or, more loosely, a fund available to European investors. These are different categories.
The Vanguard FTSE All-World High Dividend Yield UCITS ETF, commonly identified as VHYL, is a global dividend fund. Its distributing share class has ISIN IE00B8GKDB10 and an ongoing charge of 0.29%.
It invests across developed and emerging markets, making it an alternative for global income exposure rather than another Europe-only candidate.
| Your objective | Useful comparison |
|---|---|
| Increase exposure to European dividend-paying companies | European dividend ETF vs broad European equity ETF |
| Receive equity income across several regions | Global dividend ETF vs broad global distributing ETF |
| Add dividends to an existing global portfolio | Compare company, sector and regional overlap |
| Build capital without needing cash payments | Compare broad accumulating funds before adopting a dividend tilt |
A Europe-focused fund can hold UK and Swiss companies, while a eurozone fund has a narrower geographic scope. Neither label fully describes currency exposure: companies can earn revenue and incur costs in currencies different from those of their home markets.
For the broader allocation decision, see Finorum’s global vs European ETFs guide.
How much dividend income could €10,000 produce?
Convert the yield into cash before deciding whether the strategy meets your needs.
Illustrative annual cash distribution = invested amount × assumed annual distribution yield
The following example uses a hypothetical 3% distribution yield. The final column tests a 25% reduction in annual payments while the number of ETF units held remains unchanged.
| Starting investment | Annual income at 3% | Monthly equivalent | Annual income after a 25% distribution cut |
|---|---|---|---|
| €1,000 | €30 | €2.50 | €22.50 |
| €10,000 | €300 | €25 | €225 |
| €50,000 | €1,500 | €125 | €1,125 |
| €100,000 | €3,000 | €250 | €2,250 |
These hypothetical amounts are before investor-level tax and brokerage costs. They are not forecasts for the funds in this article and exclude changes in the investment’s market value. “Monthly equivalent” means annual income divided by twelve, not a monthly payment schedule.
For a beginner investing €1,000, a €30 annual distribution puts the income objective into perspective. Regular contributions and long-term portfolio performance are likely to matter more than receiving that small amount in cash.
For someone using a €50,000 portfolio to support household spending, the same calculation reveals a budgeting risk. A 25% distribution cut reduces annual income from €1,500 to €1,125 — a €375 shortfall, potentially alongside a fall in the portfolio’s value.
How much capital would support €100 a month?
Using the same hypothetical 3% yield:
Required capital = annual income target ÷ assumed distribution yield
€1,200 ÷ 0.03 = €40,000
That represents a €100 monthly equivalent before personal tax, assuming the distribution rate holds. It does not mean the €40,000 capital is protected.
If you are starting with a smaller balance, Finorum’s guide to investing €1,000 in Europe covers the broader decisions before selecting a fund.
A real payout record: quarterly does not mean equal
Franklin’s distribution history shows how income can change between years.
| Calendar year | Total distributions per share |
|---|---|
| 2023 | €1.3040 |
| 2024 | €1.2106 |
| 2025 | €1.4299 |
Calculated by summing the four payments in each calendar year from Franklin’s published distribution history. These are cash amounts per share, not percentage returns.
Individual payments also differed. The fund paid €0.3673 per share in December 2025, €0.1094 in March 2026 and €0.7591 in June 2026.
For household budgeting, inspect several years of payments and their timing. Multiplying one unusually large quarter by four can give a misleading annual estimate.
Why headline yields are not always comparable
Before placing two yield figures side by side, establish what each measures.
| Measure | What it describes |
|---|---|
| Trailing distribution yield | Historical cash distributions over a stated period relative to a specified price or NAV |
| Annualised recent distribution | A recent payment extrapolated into an annual figure |
| Portfolio dividend yield | A measure based on underlying shares, rather than necessarily the cash distributed by the ETF |
| Total return | Change in investment value plus distributions, using the stated reinvestment assumptions |
Franklin defines its displayed distribution yield using a recent distribution annualised. iShares reports a 12-month trailing dividend distribution yield. Copying those figures into one ranking would obscure the difference. Franklin methodology, iShares fund data
This is why the opening comparison prioritises fund identity, geography, costs and distribution schedules.
A rising yield can accompany a falling investment
Suppose an ETF distributed €3 per share over the previous twelve months.
At a €100 share price, its trailing yield is:
€3 ÷ €100 = 3%
If the price falls to €75 while the historical payment figure stays unchanged:
€3 ÷ €75 = 4%
The displayed yield has increased, but the investor has received no additional cash. The higher percentage comes from a lower share price.
Now consider a €10,000 holding that distributes €400 and ends the year worth €9,000. Without reinvestment, and ignoring taxes and transaction costs:
Total return = (€9,000 + €400 − €10,000) ÷ €10,000 = −6%
Dividends form part of the investment return. They do not cancel a capital loss simply because money has arrived in the brokerage account.
High dividend yield vs dividend growth
A high-yield strategy looks for dividends that are large relative to share prices. A dividend-history strategy requires a record of stable or increasing payments. Quality-dividend strategies can add measures such as profitability and financial strength.
These approaches overlap. SPYW, for example, combines a dividend-history requirement with high-yield selection.
The useful question is what a company must demonstrate to enter the index, and what causes it to leave. Check the rules alongside company weight limits, sector exposure and rebalancing frequency.
For investors researching dividend ETFs for beginners, understanding one suitable strategy is more useful than assembling several funds whose names sound complementary.
How much do the fees matter?
On a constant €10,000 balance:
| Annual fund charge | Approximate annual cost |
|---|---|
| 0.25% | €25 |
| 0.40% | €40 |
| Difference | €15 |
The difference matters when comparing funds serving the same portfolio role. It should not decide between substantially different investment strategies on its own.
Brokerage costs can have a larger immediate effect on small contributions. A €2 dealing charge on a €100 purchase consumes 2% of that contribution. Spreads, currency conversion and custody charges can add further costs.
Check the cost of your actual order and any recurring-investment plan. When examining historical performance, do not subtract TER again from returns that already reflect ongoing fund expenses.
Tax: domicile, geography and residence are separate
An Irish-domiciled ETF holding European shares combines three distinct facts: where the fund is legally established, where its portfolio invests and where you are tax resident.
Tax incurred within the fund is also different from tax charged to you on distributions or gains. There is no single “European ETF tax rate”.
Germany: check the fund classification
Germany’s Vorabpauschale can create taxable investment income without a sale or cash distribution. Qualifying equity funds also benefit from a 30% partial exemption for private investors.
The accumulating-versus-distributing decision therefore cannot be reduced to “tax now or tax only when sold”. Check the fund’s classification, available allowances and your broker’s reporting arrangements. See the statutory provisions on Vorabpauschale and partial exemptions.
France: consider the account before choosing the ETF
For French residents, a Plan d’Épargne en Actions (PEA) can change the tax treatment of eligible investments.
After the plan’s five-year period, qualifying gains withdrawn are exempt from income tax, although social contributions remain applicable. French tax authority guidance
Check the exact ETF’s eligibility and your provider’s availability. The words “European” or “UCITS” do not by themselves establish PEA eligibility.
Ireland: a specific fund-tax regime applies
From 1 January 2026, the relevant individual tax rate for Irish investment funds and equivalent qualifying offshore funds fell from 41% to 38%. Irish Revenue
That is not a universal rate for every investment or every European investor holding an Irish-domiciled ETF. Fund classification and applicable deemed-disposal rules also require attention. Revenue’s ETF tax guidance
These examples reflect the rules checked in September 2026. Check subsequent changes before using them in a 2027 tax calculation.
Finorum’s guide to accumulating vs distributing ETFs in Europe examines the wider share-class decision.
Which dividend ETF fits which job?
| Your situation | Start by comparing | Main question |
|---|---|---|
| You are building capital without needing income | Broad-market funds and dividend ETFs | Does the dividend screen suit your investment objective? |
| You want spendable equity income | Distributing share classes | Can your budget accommodate variable payments? |
| You specifically want eurozone dividend exposure | IDVY and SPYW | Which concentration and selection rules fit the intended allocation? |
| You want broader European quality-dividend exposure | iShares Quality Dividend Advanced and Franklin European Quality Dividend | Which holdings, screens and sector weights fit your portfolio? |
| You deliberately want smaller European companies | WisdomTree Europe SmallCap Dividend | Is the additional small-cap risk intentional and appropriately sized? |
Before placing an order, verify the ISIN, read the current KID, check broker charges and compare the proposed holding with your existing portfolio.
A second dividend ETF should add an exposure you want. A different issuer or payment date does not, by itself, create meaningful diversification.
Risks to check before relying on the income
Dividend-paying companies can reduce their payments while their share prices are falling. Investors can therefore face lower income and lower capital value at the same time.
Review five areas:
- Sector concentration: several holdings may respond to the same economic pressures.
- Regional concentration: European and eurozone funds exclude much of the global equity market.
- Currency exposure: trading in euros does not hedge foreign holdings or companies’ overseas earnings.
- Distribution variability: a regular payment calendar does not fix the amount.
- Fund changes: issuers can change fees, benchmarks or product availability.
Money needed for essential spending in the near term requires a plan that can withstand both a market decline and smaller distributions.
FAQ
Does a distributing ETF have to follow a dividend strategy?
No. A broad-market ETF can distribute the dividends earned by its holdings without selecting companies for high yields. The investment strategy determines which companies are held; the share class determines whether income is paid out or reinvested.
Can I buy just before the ex-dividend date to collect extra return?
Buying before the relevant ex-dividend date can establish entitlement to a payment, but it does not create free return. The distribution removes value from the fund, reflected in its NAV adjustment, while market prices also respond to trading conditions. Taxes and transaction costs can further affect the result.
Do the dividend ETFs in this comparison pay monthly?
The listed distributing share classes use quarterly or semi-annual schedules. The monthly equivalents in the income table are budgeting calculations, not their actual payment calendars.
Is an 8% distribution yield automatically better than 4%?
First check how both figures were calculated and where the cash comes from. A recent payment annualised is different from a trailing twelve-month yield. Some income products also distribute proceeds from options strategies rather than relying solely on company dividends.
Can I receive euros while holding non-euro companies?
Yes, depending on the fund’s distribution arrangements and your broker’s currency handling. The currency credited to your account does not remove the underlying investment’s currency exposure. Check payout currency and conversion charges separately.
How many dividend ETFs do I need?
There is no required number. Compare company, sector and country overlap before adding another fund. A second holding is useful when it serves a defined portfolio purpose, rather than simply providing another distribution date.
Disclaimer: The information provided on Finorum is for educational and informational purposes only and does not constitute personalised financial, investment or tax advice. Investing involves risk, including the potential loss of capital. Always conduct your own research and, where needed, consult a qualified financial or tax adviser before making investment decisions. Tax treatment depends on individual circumstances and applicable rules, which can change over time.
Iva Buće is a Master of Economics specializing in digital marketing and logistics. She combines analytical thinking with creativity to make financial and investment topics accessible to a broader audience. At Finorum, she focuses on translating complex economic concepts into clear, practical insights for everyday readers and investors.
Sources & References
EU regulations & taxation
Additional educational resources
- Blackrock.com — iShares fund data
- Dataspanapi.wisdomtree.com — WisdomTree Europe SmallCap Dividend UCITS ETF — DFE/DFEE
- Franklintempleton.co.uk — Franklin European Quality Dividend UCITS ETF — FLXD
- Franklin methodology
- Gesetze-im-internet.de — partial exemptions
- Vorabpauschale
- Ishares.com — iShares MSCI Europe Quality Dividend Advanced UCITS ETF — EQDS/QDVX
- Ssga.com — State Street SPDR S&P Euro Dividend Aristocrats UCITS ETF — SPYW
- Trading.com
- Vanguard.co.uk — Vanguard FTSE All-World High Dividend Yield UCITS ETF