

The best European index funds for broad regional exposure are those that match the European market you actually want to own. A STOXX Europe 600 ETF includes large, medium and smaller companies. An MSCI Europe ETF concentrates on large and mid-sized businesses. Both include the UK and Switzerland. A Euro Stoxx 50 ETF takes a narrower approach, holding 50 large eurozone companies.
Quick answer: compare STOXX Europe 600 and MSCI Europe for a broad European allocation. Choose Euro Stoxx 50 when you specifically want large eurozone companies. For a first equity investment, compare a global fund before committing the whole portfolio to Europe.
This guide covers funds investing in European equities. For global and US funds available to European investors, see our UCITS ETF guide.
2027 planning guide. Sources checked on 27 September 2026; individual data dates are identified below. Charges, product availability and tax rules can change.
Quick comparison: which European index fits your objective?
| Your objective | Benchmark to examine | Main trade-off |
|---|---|---|
| Broad Europe, including smaller companies | STOXX Europe 600 | Remains a regional equity investment |
| Developed European large and mid-sized companies | MSCI Europe | Excludes small caps by design |
| Large eurozone companies specifically | Euro Stoxx 50 | Excludes the UK and Switzerland |
| Increase Europe’s weight in a global portfolio | Broad European index | Adds overlap and a regional overweight |
| Build a first diversified equity holding | Compare a global index first | Europe alone leaves out major world markets |
What “European” actually tells you about a fund
The benchmark, fund domicile and trading currency answer different questions.
The benchmark determines the investment universe. Domicile is the fund’s legal home. Trading currency is the currency used to buy and sell a particular exchange listing.
An Irish-domiciled ETF can track US shares. A euro-traded ETF can own British and Swiss companies. Buying that listing in euros does not remove the portfolio’s currency exposure.
When comparing European equity ETFs, start with the benchmark’s full name. “Europe,” “eurozone” and “Europe ex UK” describe materially different portfolios.
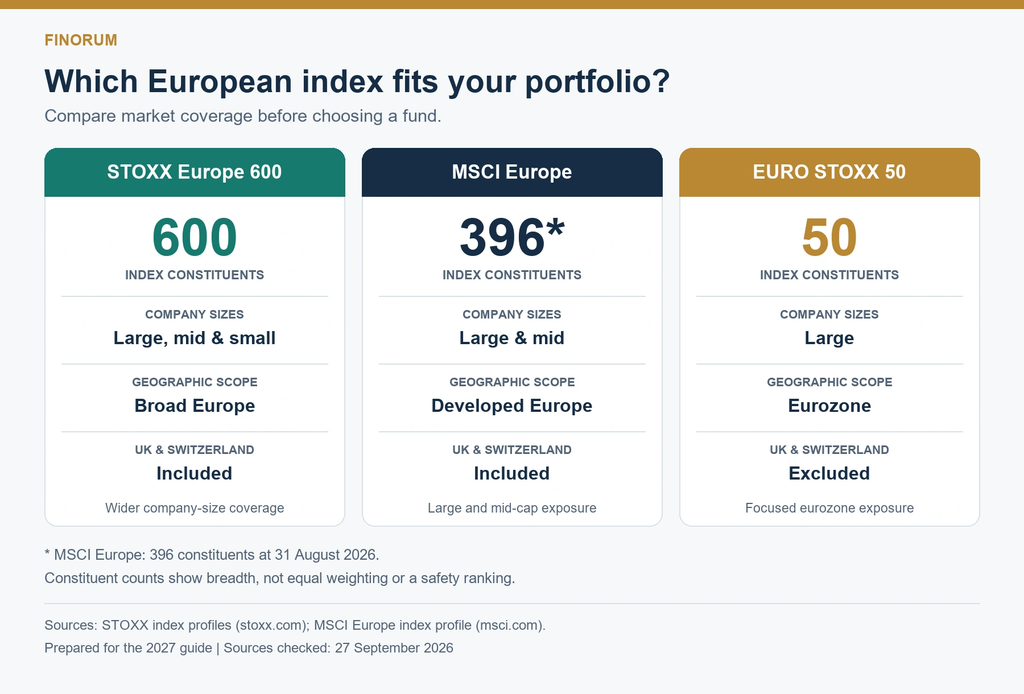
STOXX Europe 600 vs MSCI Europe vs Euro Stoxx 50
| Feature | STOXX Europe 600 | MSCI Europe | Euro Stoxx 50 |
|---|---|---|---|
| Constituents | 600 | 396 at 31 August 2026 | 50 |
| Company sizes | Large, mid and small | Large and mid | Large |
| Geographic scope | Broad European markets | Developed European markets | Eurozone |
| UK and Switzerland included | Yes | Yes | No |
| Main portfolio role | Broad Europe allocation | Broad Europe large/mid-cap allocation | Focused eurozone allocation |
Benchmark information comes from STOXX Europe 600, MSCI Europe and EURO STOXX 50.
STOXX Europe 600: wider company-size coverage
A STOXX Europe 600 ETF brings large, medium and smaller European businesses into one holding. That is useful if you want some smaller-company exposure without maintaining a separate small-cap fund.
The index is weighted by free-float market capitalisation, however. Its smaller constituents do not collectively receive the same weight as its largest companies simply because they are numerous.
Country classifications also change. STOXX’s reclassification of Greek equities from emerging to developed market status took effect on 21 September 2026. Older descriptions of the index’s geographic coverage should therefore be read against the latest composition. Source: ISS STOXX
MSCI Europe: large and mid-sized businesses
MSCI Europe targets approximately 85% of the free-float-adjusted market capitalisation of developed European equity markets. It contained 396 constituents on 31 August 2026. Source: MSCI
For a broad regional allocation, MSCI Europe and STOXX Europe 600 are close alternatives. Their different company counts do not tell you how different their returns will be. Compare the country, sector and largest-holding weights alongside the number of constituents.
Euro Stoxx 50: a specific eurozone allocation
A Euro Stoxx 50 ETF focuses on 50 large eurozone companies. It suits an investor who deliberately wants that narrower exposure.
It leaves out important European markets, including the UK and Switzerland, and offers less company breadth than either of the broader benchmarks. Familiar company names do not make it a low-risk investment.
For the separate decision between US and eurozone equities, see our S&P 500 vs Euro Stoxx 50 comparison.
Four European index ETFs to compare
These examples cover the three benchmark approaches. The selection illustrates differences in exposure and published charges; it is not a forecast of which fund will perform best.
| ETF and share class | ISIN | Benchmark | Published annual charge |
|---|---|---|---|
| Amundi Core STOXX Europe 600 UCITS ETF Acc | LU0908500753 | STOXX Europe 600 | 0.07% |
| State Street SPDR MSCI Europe UCITS ETF | IE00BKWQ0Q14 | MSCI Europe | 0.08% |
| iShares Core MSCI Europe UCITS ETF EUR (Acc) | IE00B4K48X80 | MSCI Europe | 0.12% |
| iShares Core EURO STOXX 50 UCITS ETF EUR (Acc) | IE00B53L3W79 | Euro Stoxx 50 | 0.10% |
Amundi’s figure is the management and operating cost published in its April 2026 factsheet. The other figures are TERs from the linked issuer pages checked in September 2026. These figures exclude investor-specific dealing, platform and tax costs.
All four share classes accumulate income.
Identify the share class by ISIN when searching your broker. Tickers differ between exchanges, and similarly named funds can have different distribution policies or currency-hedging arrangements.
Put fee differences into euros
On an investment held at a constant €10,000 value, the annual charges above translate approximately into:
| Annual charge | Annual cost on €10,000 |
|---|---|
| 0.07% | €7 |
| 0.08% | €8 |
| 0.10% | €10 |
| 0.12% | €12 |
These costs are reflected in the fund’s value rather than arriving as a separate annual bill. Actual euro costs change with the investment’s value.
Comparing the two MSCI Europe ETFs, a difference between 0.12% and 0.08% amounts to roughly €4 a year per €10,000. That is a useful comparison because both track the same benchmark.
Moving from a 0.12% MSCI Europe ETF to a 0.10% Euro Stoxx 50 ETF would save approximately €2 on that amount, while substantially changing the investment universe. The geographic decision deserves more attention than the €2.
For small monthly purchases, broker charges can be more consequential. A €2 commission on a €100 purchase consumes 2% of that contribution immediately. Twelve purchases cost €24 before considering spreads or fund charges.
For larger portfolios, recurring percentage charges deserve closer attention: the same 0.04-percentage-point fee difference is approximately €100 annually on €250,000.
Check how closely the fund follows its index
The advertised charge is only one part of implementation.
Tracking difference is the difference between a fund’s return and its benchmark return over a specified period. Tracking error measures the variability of periodic return differences around their average.
For example, a fund returning 7.8% against a benchmark’s 8.0% has a tracking difference of −0.2 percentage points for that period. That single observation does not tell you its tracking error.
Use matching dates, currencies and benchmark versions. Gross-return and net-return indices treat dividend withholding differently, so mixing them produces a misleading comparison.
Avoid adding the TER to an observed tracking shortfall as though they were entirely separate costs: the fund’s reported performance already reflects its fund-level charges.
How much Europe will your portfolio actually own?
A global equity ETF already includes European companies. Adding a regional fund increases that existing allocation.
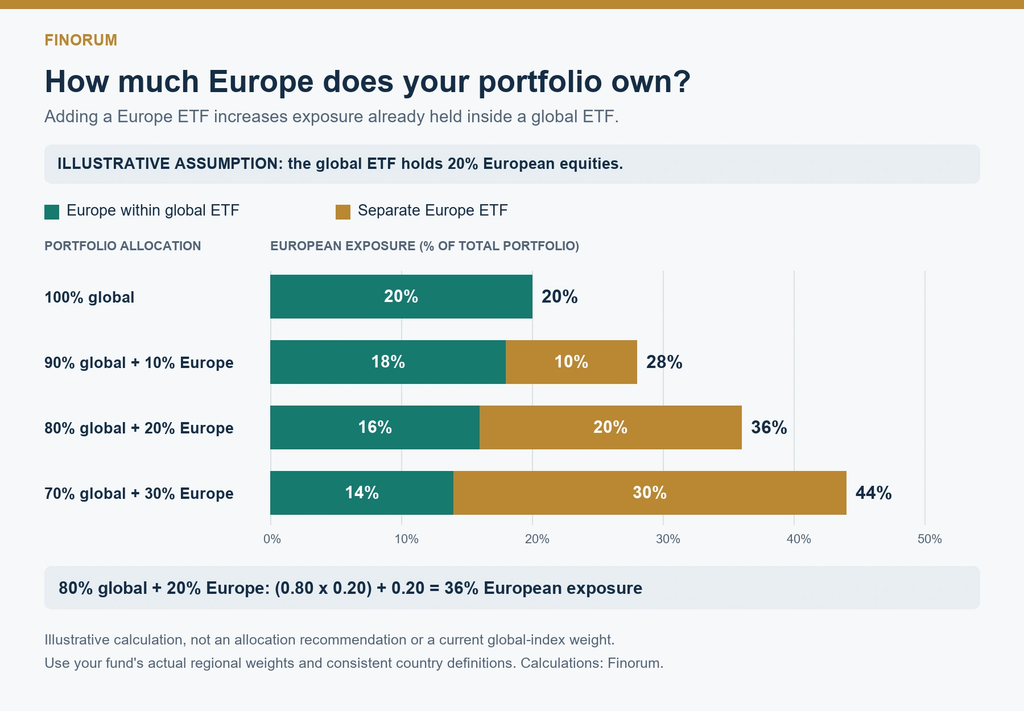
Suppose Europe accounts for 20% of a hypothetical global ETF:
| Portfolio allocation | Europe inside global holding | Separate Europe holding | Total European exposure |
|---|---|---|---|
| 100% global | 20% | 0% | 20% |
| 90% global + 10% Europe | 18% | 10% | 28% |
| 80% global + 20% Europe | 16% | 20% | 36% |
| 70% global + 30% Europe | 14% | 30% | 44% |
Use this formula:
Total European weight = (global fund allocation × Europe’s weight within that fund) + regional Europe allocation
For the 80/20 example:
(0.80 × 0.20) + 0.20 = 0.36, or 36%
A €10,000 portfolio would therefore contain approximately €3,600 of European exposure, including both holdings.
The 20% starting figure is an assumption, not the current allocation of a named global index. Substitute your fund’s latest geographic breakdown and use consistent country definitions.
Our global vs European ETFs guide explores when an additional regional allocation serves a clear purpose.
Does owning two European ETFs improve diversification?
Buying both MSCI Europe and STOXX Europe 600 creates considerable overlap. The second holding changes weights and company coverage, but many major holdings remain shared.
Adding Euro Stoxx 50 to either broad benchmark increases exposure to large eurozone companies already represented in the portfolio.
Before adding a fund, write down the intended change: more small companies, a larger eurozone allocation or a specific regional target. Then check whether the proposed fund actually delivers it.
This matters particularly with smaller balances. Maintaining several overlapping holdings can add trading costs and rebalancing work without substantially changing the portfolio. Our €1,000 ETF portfolio guide compares the practical consequences of one fund versus two.
European index mutual funds vs ETFs
An index fund follows an index. An ETF trades on an exchange. These descriptions overlap, but they are not interchangeable: ETFs can also use active strategies, as the French financial regulator AMF explains.
| Feature | Index ETF | Conventional index mutual fund |
|---|---|---|
| How you invest | Exchange order or broker savings plan | Subscription through a provider or platform |
| Pricing | Market price during trading hours | NAV-based dealing price |
| Costs to compare | Fund charge, spread, commission and platform fees | Fund charge, platform fees and possible dealing adjustments |
| Minimum investment | Whole share or supported fraction | Share-class and platform minimum |
| Tax considerations | Residence and account rules | Residence, account rules and fund eligibility |
A conventional fund can be competitive when the account makes regular contributions inexpensive or provides a relevant tax advantage.
One example is the Vanguard European Stock Index Fund Investor EUR Accumulation, ISIN IE0007987690. It tracks MSCI Europe, and its KID lists annual management and operating costs of 0.12%, with portfolio transaction costs shown separately.
Access matters. Vanguard’s professional product page lists a €1 million minimum initial investment for that share class. Check the exact products and terms available through your own account before treating a low published fee as an accessible retail option.
Local tax rules can change the choice
These examples describe rules checked in September 2026. They should be reviewed for changes before a 2027 transaction.
France: check PEA eligibility before fees
A European equity portfolio does not automatically make an ETF eligible for a Plan d’épargne en actions, or PEA. State Street’s product page explicitly identifies the MSCI Europe ETF above as not PEA eligible.
For withdrawals after the plan’s fifth anniversary, qualifying PEA gains are exempt from income tax, although social contributions remain payable. The holding period concerns the plan, rather than restarting whenever a new security is purchased inside it. Source: French tax authority
For a French PEA investor, eligibility is the first filter. Compare fees among products that can actually be held in the account.
Germany: equity-fund classification matters
For private investors, Germany’s Investment Tax Act provides a 30% partial exemption for investment income from qualifying equity funds. Check the product’s tax classification rather than assuming that any fund with “equity” in its marketing description qualifies. Source: section 20, Investment Tax Act
Accumulating funds can also give rise to a Vorabpauschale, subject to the statutory calculation and limits. Reinvesting distributions inside the fund therefore does not automatically defer all taxation until sale. Source: section 18
Spain: compare fund-transfer treatment
Spain’s traspasos regime can defer taxation when investments move between qualifying conventional funds.
ETFs are generally excluded from this treatment. There are transitional provisions for certain foreign-listed holdings acquired before 2022, so older positions require a closer look. Source: Agencia Tributaria
For a Spanish resident expecting to switch funds over time, this can make a qualifying conventional index fund worth comparing with an ETF. Confirm that both the product and the transaction meet the requirements.
A practical decision framework
| Your situation | Start here | Then check |
|---|---|---|
| First equity investment | Decide between global and regional coverage | Whether Europe alone meets your diversification objective |
| Small monthly contributions | Compare purchase costs | Savings-plan fees, minimum orders and fractional access |
| Existing global ETF | Calculate your current European weight | How much regional overweight you intend to add |
| Larger established portfolio | Define Europe’s target allocation | Tracking, execution costs, tax and rebalancing |
| French PEA | Identify eligible products | Benchmark and charges within that shortlist |
| Spanish resident expecting fund switches | Compare transfer eligibility | Conventional funds alongside ETFs |
| Moving between countries | Review the destination’s rules | Account access, reporting and treatment of existing holdings |
For the benchmark itself, the decision is straightforward: examine STOXX Europe 600 for broader company-size coverage, MSCI Europe for developed European large and mid caps, and Euro Stoxx 50 for a deliberate large-company eurozone allocation.
Income level alone does not determine the right benchmark. The investment’s role, time horizon and place in the wider portfolio matter more.
Risks to check before buying
All three benchmarks invest in equities and can suffer substantial losses. Money needed for a near-term expense deserves a different assessment from money intended for long-term investment.
Check the fund’s largest holdings and sector weights rather than judging diversification by constituent count alone. Currency exposure also survives a euro-denominated listing: broad Europe funds hold non-euro markets, while eurozone businesses can earn revenue worldwide.
Finally, read the exact benchmark name. ESG exclusions, alternative weighting rules and currency hedging can change a fund’s behaviour enough that it should be assessed separately from the standard index.
FAQ
Which European index funds include the UK and Switzerland?
Funds tracking the standard STOXX Europe 600 or MSCI Europe benchmarks include both markets. Euro Stoxx 50 funds do not. An “ex UK” variation changes that answer, so check the full index name.
Does STOXX Europe 600 provide a complete European small-cap portfolio?
No. Its fixed 600 constituents span several company sizes, but it does not hold every listed European small company. A dedicated small-cap index serves a different purpose.
Is a Euro Stoxx 50 ETF safer because its companies are large?
Large companies can suffer sharp losses. Fifty holdings also leave more company concentration than a broader regional index. Assess the allocation without treating company size as capital protection.
Should I choose an accumulating or distributing share class?
Accumulating classes retain and reinvest income; distributing classes pay it out. Choose around your cash-flow needs, reinvestment costs and local tax treatment. Our accumulating vs distributing ETFs guide explains the practical differences.
Does Irish domicile mean the ETF invests in Ireland?
No. Domicile identifies the fund’s legal home. Its investment policy and benchmark determine which markets it owns.
When does switching to a cheaper ETF pay for itself?
Divide the one-off switching cost by the expected annual saving.
For example, reducing a charge from 0.12% to 0.08% on €10,000 saves approximately €4 annually. If switching costs €20, the simple break-even period is five years, assuming a constant investment value and no additional tax cost.
Include any tax triggered by selling, and confirm that the replacement tracks the exposure you want.
Disclaimer: The information provided on Finorum is for educational and informational purposes only and does not constitute personalised financial, investment or tax advice. Investing involves risk, including the potential loss of capital. Always conduct your own research and, where needed, consult a qualified financial or tax adviser before making investment decisions. Tax treatment depends on individual circumstances and applicable rules, which can change over time.
Matias Buće has a formal background in administrative law and more than ten years of experience studying global markets, forex trading, and personal finance. His legal training shapes his approach to investing — with a focus on regulation, structure, and risk management. At Finorum, he writes about a broad range of financial topics, from European ETFs to practical personal finance strategies for everyday investors.
Sources & References
EU regulations & taxation
- Fund-docs.vanguard.com — KID lists annual management and operating costs of 0.12%
- Gesetze-im-internet.de — Source: section 20, Investment Tax Act
- Impots.gouv.fr — Source: French tax authority
Additional educational resources
- Amf-france.org — French financial regulator AMF explains
- Amundietf.fr — Amundi Core STOXX Europe 600 UCITS ETF Acc
- Gesetze-im-internet.de — Source: section 18
- Ishares.com — iShares Core EURO STOXX 50 UCITS ETF EUR (Acc)
- iShares Core MSCI Europe UCITS ETF EUR (Acc)
- Iss-stoxx.com — Source: ISS STOXX
- Msci.com — Source: MSCI
- Sede.agenciatributaria.gob.es — Source: Agencia Tributaria
- Ssga.com — State Street SPDR MSCI Europe UCITS ETF
- Stoxx.com — EURO STOXX 50
- STOXX Europe 600
- Trading.com
- Vanguard.co.uk — professional product page