S&P 500 vs Euro Stoxx 50 UCITS (2026): Which ETF Is Better for European Investors? The question of how European investors should position themselves between the S&P 500 vs Euro Stoxx 50 UCITS has become far more relevant in 2026 than it was just a few years ago.
Disclaimer:
The information provided on Finorum is for educational and informational purposes only and does not constitute financial, investment, or tax advice.
Investing involves risk, including the potential loss of capital.
Always conduct your own research or consult a qualified financial advisor before making investment decisions.
Finorum does not promote or endorse any specific financial products or
Introduction
Across Europe, the same debate keeps resurfacing — investors aren’t just deciding how to invest, but where their core equity exposure should come from. And sooner or later, everything narrows to two benchmarks: S&P 500 vs Euro Stoxx 50.
A simple choice? Not really.
The S&P 500 reflects roughly 80% of the large-cap free-float US equity market, powered by the tech names that have reshaped global returns for more than a decade. The Euro Stoxx 50, in contrast, distills Europe’s industrials, financials, luxury houses and energy giants into a concentrated lineup of fifty blue-chip companies. Fewer constituents, different sectors, different cycles. And in early 2025, an interesting twist appeared — in several periods, the Euro Stoxx 50 actually outperformed the S&P 500 (+17% vs. roughly +5% YTD), even though the long-term picture still tilts toward the US.
So what are you really choosing between?
Not just geography. It’s diversification, volatility, tax drag, sector concentration — and, something many investors miss — how UCITS structures behave under European regulation.
Luca from Italy learned that the hard way. He compared a US-domiciled S&P 500 ETF with an Irish-domiciled UCITS equivalent and noticed a detail that quietly changes everything: 30% US withholding tax on dividends vs. 15% under Irish UCITS treaties. That difference compounds. And it often influences long-term outcomes more than a neat 0.07% vs. 0.12% TER comparison.
Funny thing is, most investors assume both indices “work the same”.
They don’t.
This article looks beyond price charts — breaking down index composition, performance behaviour, costs, tax rules, and practical implications for European investors in 2026. Because a decision that sounds straightforward — S&P 500 vs Euro Stoxx 50 — ends up shaping how your portfolio behaves for years.
What Are the S&P 500 and Euro Stoxx 50?
Before comparing S&P 500 vs Euro Stoxx 50, it’s worth looking at what these indices actually represent. On paper, they look similar — two regional benchmarks, two familiar names. In reality, they behave nothing alike. And that’s where most investors misjudge them.
The S&P 500 Index (United States)
The S&P 500 remains the core reference point for US equities. It covers 500 large-cap companies and captures roughly 80 percent of the US free-float market. By the end of 2025, the index sat on close to $48 trillion in market capitalisation — growth driven largely by the tech rally in Q3 and Q4.
Most people focus on the tech exposure first — understandably — but the real story is scale. This is a market so broad that almost every sector of the US economy appears in it. Morningstar’s 2025 sector distribution illustrates the point: roughly 28–37 percent technology, 13 percent healthcare, 12 percent financials, 10 percent consumer discretionary and around 8 percent industrials.
And then comes the currency. Carlos from Spain discovered that the hard way when a weakening euro in 2025 boosted his S&P 500 UCITS returns by roughly twelve percent more than expected. Currency works both ways. It magnifies success — and mistakes.
The Euro Stoxx 50 Index (Eurozone)
The Euro Stoxx 50 tracks fifty blue-chip companies across eleven eurozone countries, with a combined market value of around three trillion euros. Names like LVMH, Siemens and TotalEnergies dominate the list. According to Stoxx data, it remains the most widely used benchmark in continental Europe.
But here’s the question investors tend to overlook: what do you lose in diversification when you move from 500 companies to just 50?
Sector composition explains the shift. Financials and industrials make up a substantial share — around 20 and 17 percent respectively — while luxury and consumer names take roughly 15 percent. And technology? Minimal. Most datasets, including justETF, place Euro Stoxx tech exposure in the 5–8 percent range. It’s a completely different engine compared with the S&P 500.
For euro-based investors, the appeal is clear: no USD swings, euro-denominated dividends, and exposure to familiar corporate champions. But the trade-off is a narrower index, higher concentration risk, and a cyclical profile that often mirrors Europe’s economic mood more than global growth.
Choosing between the two isn’t simply picking America or Europe. It’s choosing between a tech-heavy, globally driven growth engine and a concentrated eurozone basket whose performance leans on industry, finance and luxury. Some investors use both — the S&P 500 for long-term compounding, the Euro Stoxx 50 for currency stability and dividends — but the balance depends entirely on risk tolerance and time horizon.
Historical Performance Comparison: S&P 500 UCITS vs Euro Stoxx 50 UCITS
When European investors compare S&P 500 vs Euro Stoxx 50, the discussion usually turns to long-term returns. And for good reason — the historical gap between the two has shaped portfolio outcomes for more than two decades. Still, numbers alone rarely tell the full story.
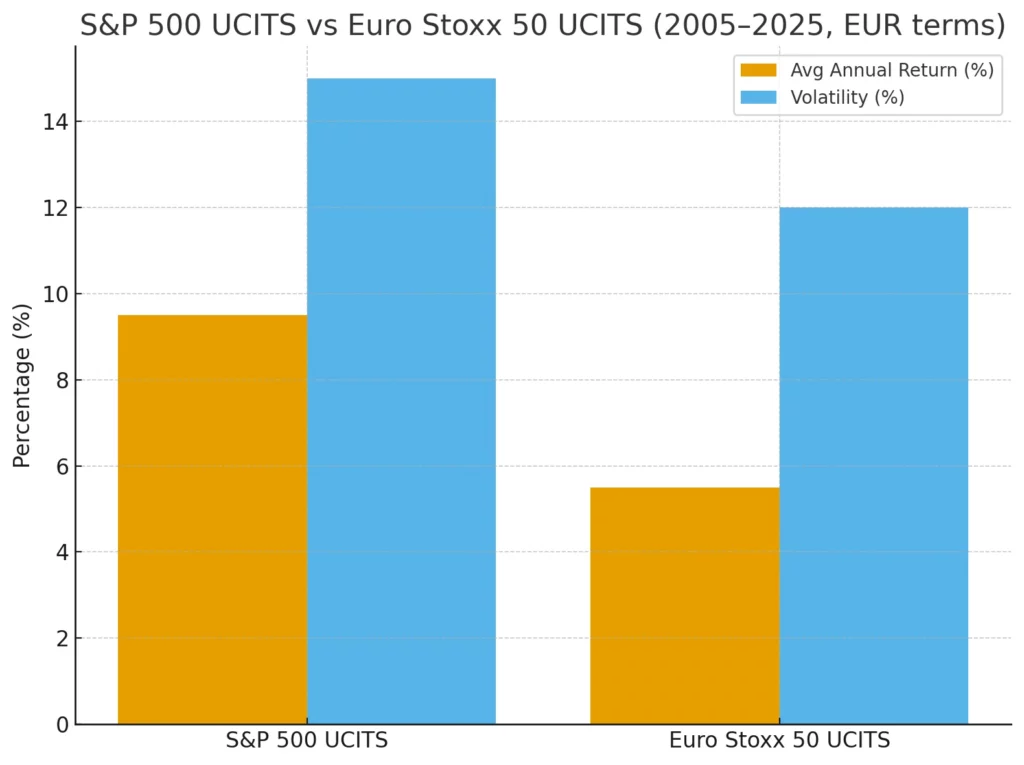
Comparison of average annual returns and volatility for S&P 500 UCITS and Euro Stoxx 50 UCITS (2005–2025, EUR terms).
Long-Term Returns (EUR, 2005–2025)
Backtests from Curvo.eu combined with Stoxx historical data show a clear divergence in performance and drawdowns.
| Index | Annualised (2005–25, EUR) | Best Year | Worst Year | Volatility | Max Drawdown |
|---|---|---|---|---|---|
| S&P 500 UCITS | ~9.5% | +31% (2019) | –37% (2008) | ~15% | –55% |
| Euro Stoxx 50 UCITS | ~5.5% | +21% (2009) | –44% (2008) | ~12% | –60% |
Two patterns stand out.
The S&P 500 has delivered nearly double the annualised return over twenty years. And while the Euro Stoxx 50 occasionally shows lower volatility, it hasn’t translated into stronger long-term compounding.
And then there’s the currency effect — something investors tend to underestimate. Emil from Denmark experienced this twice: a roughly +12 percent USD boost in 2020–2021, followed by an –8 percent drag when the euro strengthened between 2023 and 2025. FX can quietly rewrite a decade of results.
The practical question becomes: is the growth premium worth the currency exposure? For many, it is. For others, it’s the reason UCITS hedged share classes exist.
10-Year Snapshot (2015–2025)
Looking at a shorter window doesn’t change the story — it makes it clearer.
- S&P 500 UCITS (EUR): roughly +220% total return (~14% per year)
- Euro Stoxx 50 UCITS: around +80% total return (~6% per year)
The gap didn’t appear by accident. It’s the product of a decade dominated by US technology and a much slower earnings cycle in Europe. In other words, it isn’t marginal. It’s structural.
And here’s where the comparison becomes practical rather than historical.
Investors who prioritise long-term growth tend to lean toward the S&P 500 because its compounding has simply been stronger. The Euro Stoxx 50, by contrast, offers something the S&P can’t: stability in euros and exposure to Europe’s corporate heavyweights — traits that matter to investors who want less currency noise or who prefer a more traditional sector profile.
Some try to bridge the gap. Those who want US growth without the FX swings often use hedged UCITS variants such as iShares S&P 500 EUR Hedged UCITS (TER around +0.10%). That approach preserves the equity exposure while muting the currency effect.
Ultimately, the choice isn’t about which index “won” the last decade. It’s about how much volatility — and how much currency risk — you’re prepared to accept along the way.
ETF Options: S&P 500 UCITS vs Euro Stoxx 50 UCITS
For European investors, choosing between S&P 500 vs Euro Stoxx 50 isn’t just about the index. The ETF wrapper itself — domicile, TER, replication method, hedging, fund size — can shift long-term results more than many expect. justETF’s database makes that obvious: both categories include large, liquid ETFs from iShares, Amundi, SPDR and Xtrackers, but the structural differences are not the same on each side.
S&P 500 UCITS ETFs
Most S&P 500 UCITS funds sit in Ireland or Luxembourg, and that detail matters. Irish-domiciled ETFs typically benefit from a reduced US dividend withholding tax rate of 15 percent (rather than the standard 30 percent on US-domiciled funds). Over twenty or thirty years, that tax differential has more impact than a neat TER comparison.
These funds are also among the largest in Europe. Several exceed 40–60 billion euros in assets, which keeps bid–ask spreads tight and trading friction low.
Examples (2025):
- iShares Core S&P 500 UCITS ETF (Acc), TER 0.07%, Ireland domicile, physical replication, accumulating, AUM ~€55bn
- SPDR S&P 500 UCITS ETF, TER 0.09%, Ireland domicile, physical replication, distributing, AUM ~€45bn
- Amundi S&P 500 UCITS ETF, TER 0.05%, Luxembourg domicile, physical replication, cost-focused
Many of these ETFs also offer EUR-hedged share classes. They reduce currency swings, though typically at a slightly higher TER. It’s a trade-off that some investors accept when USD volatility becomes uncomfortable.
Euro Stoxx 50 UCITS ETFs
Euro Stoxx 50 ETFs attract a different investor profile. They offer euro-denominated exposure, regular distributions, and a simpler link to the eurozone economy. They’re smaller than their S&P 500 counterparts — usually in the 10–15 billion euro range — but still highly liquid across Xetra, Euronext and Borsa Italiana.
Examples (2025):
- iShares Core Euro Stoxx 50 UCITS ETF (DE), TER 0.10%, Germany domicile, physical replication, distributing, AUM ~€15bn
- Amundi Euro Stoxx 50 UCITS ETF, TER 0.15%, Luxembourg domicile, Acc/Dist options, AUM ~€10bn
- Xtrackers Euro Stoxx 50 UCITS ETF, TER 0.09%, Luxembourg domicile, synthetic replication, AUM ~€12bn
These funds are particularly popular with income-focused investors. Regular quarterly or semi-annual payouts — in euros — simplify budgeting, especially for retirees or conservative savers.
But what do you give up? Diversification. Moving from 500 companies to 50 introduces concentration risk that becomes visible during cyclical downturns.
Quick ETF Comparison
| Feature | S&P 500 UCITS ETFs | Euro Stoxx 50 UCITS ETFs |
|---|---|---|
| Typical TER | 0.05–0.09% | 0.09–0.20% |
| Replication | Mostly physical | Physical & synthetic |
| Domicile | Ireland / Luxembourg | Germany / Luxembourg |
| Currency | USD (hedged classes available) | EUR |
| Distribution Options | Mostly accumulating, some distributing | Both accumulating & distributing |
| Fund Size (AUM) | €40–60bn | €10–15bn |
| Listings | Xetra, Euronext, Borsa Italiana, LSE | Xetra, Euronext, Borsa Italiana |
| ESG Variants | Available | Available |
Under the surface, the contrasts are obvious: S&P 500 UCITS ETFs tend to be cheaper, larger and more liquid; Euro Stoxx 50 ETFs offer currency stability and often better income mechanics.
Why the Structure Matters in Practice?
Hedged versus unhedged. Accumulating versus distributing. Ireland versus Luxembourg. These aren’t footnotes — they’re structural levers that change long-term after-tax outcomes.
Elena in Italy uses the Amundi S&P 500 UCITS (Acc) for her pension account because it reinvests dividends automatically, avoiding annual taxable payouts. Markus in Austria does the opposite: he holds the iShares Core Euro Stoxx 50 (Dist) because the euro-denominated dividends help him cover monthly expenses. Same asset class, entirely different objectives.
The choice between the two indices is only half the story. The ETF you select — and the share class you select — often matters just as much.
Risks and Volatility: S&P 500 UCITS vs Euro Stoxx 50 UCITS
Looking at S&P 500 vs Euro Stoxx 50 through performance charts alone is tempting, but it rarely tells you how each index behaves when things get rough. And that behaviour — the part investors often overlook — is where the real differences lie.
Currency Risk
For European investors, currency is often the swing factor.
S&P 500 UCITS ETFs are denominated in USD (even when they trade in EUR on European exchanges), which means every move in EUR/USD lands in your portfolio, whether you wanted the exposure or not. A stronger dollar can feel like free performance; a weaker one does the opposite.
Some investors try to smooth this out with EUR-hedged share classes. They do calm the ride, though usually at a higher TER. Whether that trade-off makes sense isn’t a technical question — it’s a tolerance question.
Sector and Market Concentration
Then comes concentration, and here the gap between the two indices becomes obvious.
In the S&P 500, technology sits around 28 percent of the index, and the top ten companies now make up roughly a third of its market value. Several major investment banks flagged in 2025 that this is the highest concentration level the index has ever seen. That can be brilliant in strong markets. It can also be painful when megacaps stumble.
The Euro Stoxx 50 sits on a very different footing.
Technology is barely eight percent of the index. Financials, industrials and energy do the heavy lifting. It’s less dependent on a small group of giants, but it’s also more exposed to Europe’s economic cycles. And with only fifty companies inside, concentration simply takes a different form — fewer names, fewer places to hide.
So the question becomes: which type of concentration feels more acceptable to you?
Geopolitical and Economic Sensitivity
Policy environments matter more than many retail investors assume.
S&P 500 UCITS ETFs move in step with Federal Reserve decisions, US rate expectations and regulatory winds from Washington — especially anything touching large tech platforms.
Euro Stoxx 50 UCITS ETFs respond to a different set of levers: ECB decisions, eurozone inflation, fiscal debates inside the EU machinery, and regulations that often tighten in cycles. The two regions don’t always react to crises in the same way. Investors usually notice this only after the fact.
Volatility and Returns (2005–2025, EUR)
The numbers make the pattern clearer:
- S&P 500 UCITS: volatility around 15%, a –55% drawdown in 2008, long-term annualised returns near 9–10%.
- Euro Stoxx 50 UCITS: volatility around 12%, a –60% drawdown, long-term returns near 5–6%.
Higher volatility on the S&P 500 side — but also faster recoveries and stronger compounding.
Europe tends to catch up later, sometimes much later.
Hedged vs Unhedged
Currency exposure isn’t a technical detail. It shows up directly in the numbers — sometimes quietly, sometimes dramatically.
Anna in Germany chose a EUR-hedged S&P 500 UCITS ETF because she was tired of watching her returns move every time the EUR/USD chart twitched. The hedged class cost a bit more each year, but the ride felt steadier. She preferred that trade-off.
Luca in Italy went the other way. He held an unhedged S&P 500 UCITS ETF. When the dollar strengthened in 2022–2023, his gains were noticeably higher than the index itself. When the euro recovered between 2023 and 2025, the effect flipped. Same benchmark, same ETF family — two completely different experiences.
Hedged versus unhedged isn’t a cosmetic preference. It changes how your portfolio behaves.
And this is where the bigger picture becomes clearer. The S&P 500 today is more concentrated and more volatile than in previous cycles, but it has also been the stronger long-term compounder. The Euro Stoxx 50 offers euro stability and a more traditional sector mix, though with slower structural growth.
Many European investors end up holding both. Not out of indecision, but because each index carries risks the other one doesn’t.
Diversification works only when the differences are real.
Tax and Regulatory Considerations: S&P 500 UCITS vs Euro Stoxx 50 UCITS
The difference between S&P 500 vs Euro Stoxx 50 isn’t only about performance. For European investors, tax treatment and regulation often shape outcomes just as much as market returns — sometimes more. And unlike price movements, these rules tend to stay in place for years.
The UCITS Framework
Both indices are accessed through UCITS ETFs — Europe’s system built around diversification rules, transparency and cross-border investor protection. It’s also what makes an Irish-domiciled ETF just as accessible in Portugal as in Finland.
And it explains something else: why most retail investors in Europe cannot buy US-domiciled ETFs like SPY or VOO. Because these funds don’t provide a PRIIPs-compliant Key Information Document, brokers restrict access, creating a de facto ban for ordinary investors. Not by design — by regulation.
Dividend Withholding Tax
Once dividends enter the picture, the differences become concrete.
Non-treaty domiciles can face the full 30 percent US withholding tax. Irish-domiciled S&P 500 UCITS ETFs avoid this through the US–Ireland treaty, reducing the rate to 15 percent. Same index, same companies — different net yield.
Euro Stoxx 50 ETFs operate under a different dynamic. Dividends arrive from companies across multiple eurozone countries, each with its own withholding rules. Some of that tax is recoverable through treaties; some isn’t. Leakage remains — something KPMG’s annual comparisons highlight repeatedly.
Typical ranges reflect that reality:
S&P 500 UCITS funds land around 2.0–2.5 percent net yield; Euro Stoxx 50 UCITS funds around 2.5–3.0 percent, although the latter is often trimmed by multi-country leakage.
Small differences on paper. Not small over time.
PRIIPs Regulation
Since 2018, PRIIPs rules have required ETFs sold to European retail investors to provide a standardised Key Information Document. UCITS ETFs comply. US ETFs don’t.
That alone determines what most investors can and cannot buy.
Oversight and Prospectus Rules
ETFs are supervised by national regulators even when listed across Europe.
A SPDR S&P 500 UCITS ETF falls under the Central Bank of Ireland. An iShares Euro Stoxx 50 UCITS ETF may fall under BaFin. Each fund’s prospectus sets out the replication method, risk profile and tax handling. Dry documents, but essential — UCITS works because of this consistency.
Tax Efficiency in Practice
Klara in Germany invests €50,000 in an Irish-domiciled S&P 500 UCITS ETF. With the US–Ireland treaty, dividend withholding drops to 15 percent, leaving her with a net yield close to 2.2 percent.
Miguel in Spain places the same amount in a German-domiciled Euro Stoxx 50 ETF that distributes income. The gross yield looks higher — roughly 3.5 percent — but multi-country withholding taxes and Spain’s dividend rules reduce the net figure to about 2.6 percent. These are approximate ranges based on 2025 yields and treaty effects, not fixed rates.
His headline yield and his real yield are two different numbers.
And that’s where these rules begin to matter. Irish-domiciled S&P 500 UCITS ETFs tend to offer the strongest tax efficiency for broad US exposure. Euro Stoxx 50 ETFs from Germany or Luxembourg appeal to investors who want euro-denominated income, though some leakage is inevitable.
Domicile isn’t marketing — it decides how dividends move through the tax system. And over a decade or more, that can matter far more than a 0.05 percent difference in TER.
Case Studies: European Investors in Practice
Numbers and regulations matter, but real decisions are usually made for simpler reasons: income needs, long-term plans, and what someone is personally comfortable holding. Here are three snapshots of how Europeans approach the S&P 500 vs Euro Stoxx 50 question in 2026.
Anna (Germany): Prefers Stability in Euros
Anna is a 38-year-old engineer in Berlin. She likes things she can plan around, which is why she leans toward the Euro Stoxx 50 UCITS — the distributing version in particular. The dividends arrive in euros, fit neatly into her monthly budgeting, and the companies inside the index feel familiar.
She also appreciates that reporting under German tax rules stays simple. No currency conversions, no extra steps.
- Portfolio size: ~€30,000
- Choice: iShares Core Euro Stoxx 50 UCITS ETF (DE), distributing
- Why it fits: euro income, straightforward taxation, and a UCITS structure that’s supervised locally under BaFin rules
For her, predictability is worth more than chasing a few extra percentage points.
Luca (Italy): Targets Long-Term Growth Through the S&P 500
Luca is 29 and thinks on a 20- to 30-year horizon. For him, the S&P 500 is where long-term compounding happens — especially through the accumulating version of the Amundi S&P 500 UCITS ETF. He’s aware that Amundi runs both Irish- and Luxembourg-domiciled share classes, and he specifically prefers the Irish domicile because it reduces the US dividend withholding tax to 15 percent. A small detail, but meaningful over decades.
Currency swings don’t stress him out. He’s investing for retirement, not next summer.
- Portfolio size: ~€15,000, adding €500 per month
- Choice: Amundi S&P 500 UCITS ETF (Acc), Irish share class where available
- Why it fits: low TER, strong US tech exposure, long-term compounding, UCITS-compliant and listed on major exchanges like Xetra/Euronext
For Luca, the logic is simple: he wants the strongest growth engine he can reasonably access.
Sophie (France): Blends Both for Balance
Sophie teaches literature in Lyon and prefers not to choose between the two camps. She splits her equity exposure — roughly sixty percent in the S&P 500 UCITS, forty percent in the Euro Stoxx 50 UCITS. It gives her global growth on one side and euro stability on the other.
She doesn’t obsess over currency moves or sector rotations. She just likes the idea that different parts of the world are working for her at different times.
- Portfolio size: ~€80,000
- Choice: SPDR S&P 500 UCITS ETF (Dist) + Amundi Euro Stoxx 50 UCITS ETF (Acc)
- Why it fits: diversification across currencies, economies and regulatory regimes, all within the UCITS framework
Sophie’s approach isn’t complicated. It’s balanced — and for her, that’s enough.
These three examples point toward the same truth: there’s no universal answer. Some people need euro income. Others want long-term growth. Many prefer a mix. The right choice depends on where you live, how you’re taxed, and how you react when markets move faster than you’d like.
How Experienced Investors Actually Approach S&P 500 and Euro Stoxx 50
Even investors with years of market experience admit that the choice between these two indices isn’t as simple as it first appears. Most professionals arrive at a similar conclusion — though often for different reasons. The nuance sits in taxes, currencies, and how each index behaves inside a long-term portfolio.
Look Beyond “Either–Or”
Seasoned investors rarely frame the decision as S&P 500 versus Euro Stoxx 50. They usually hold both.
The S&P 500 provides global growth exposure; the Euro Stoxx 50 anchors the portfolio with euro-denominated stability. One compounds aggressively, the other smooths out the ride.
Domicile Shapes Your Net Return
For S&P 500 exposure, domicile isn’t a footnote.
An Irish-domiciled UCITS ETF benefits from the US–Ireland treaty and limits US dividend withholding to 15 percent. Non-treaty domiciles can face the full 30 percent rate. Over decades, that difference compounds — far more than many investors expect. PwC and KPMG highlight this repeatedly in their cross-border tax analysis.
Understand the Real Cost of Hedging
EUR-hedged S&P 500 UCITS ETFs mute USD volatility, but they usually come with a higher TER. The premium varies by provider and share class, yet the principle is the same: stability costs something.
Some investors don’t mind the swings. Others lose sleep over them. Preferences, not formulas.
Match the Share Class to Your Intentions
An accumulating class suits investors who want compounding without taxable payouts.
A distributing class fits those who rely on steady income in euros.
It sounds like a small distinction. It isn’t — it determines how the ETF behaves over time.
Don’t Let Headline Yields Mislead You
Euro Stoxx 50 UCITS ETFs often show yields above three percent, but multi-country tax leakage typically narrows the final figure. S&P 500 yields start lower, yet Irish-domiciled ETFs often retain more on a net basis.
Gross yield is not the yield that matters.
And that’s the thread running through all of this. The S&P 500 UCITS ETF has historically delivered stronger long-term compounding, while the Euro Stoxx 50 UCITS ETF offers currency alignment and stability. Many European investors hold both because each fills a gap the other cannot.
Resilient portfolios are built when those differences are used deliberately — not accidentally.
Conclusion
Choosing between the S&P 500 UCITS and the Euro Stoxx 50 UCITS isn’t a clean analytical exercise. On papiru, razlika izgleda kao usporedba prinosa i troškova. U praksi, odluka se najčešće svodi na nešto puno jednostavnije: kako želite da se vaš portfelj ponaša kad tržišta postanu neugodna.
The S&P 500 has been the stronger engine of long-term compounding — that much is difficult to dispute. But it’s also more concentrated, more volatile and tied to a currency that doesn’t always cooperate with European investors. The Euro Stoxx 50, for all its lower growth, carries a different kind of comfort: euro-denominated payouts, simpler tax reporting, and sector exposure that reflects Europe’s economic core rather than Silicon Valley.
Neither index is perfect. Both have blind spots.
And that’s precisely why many investors end up holding the two together. The weaknesses of one tend to be the strengths of the other.
In the end, this decision isn’t about betting on one region over another; it’s about deciding which risks you want — and which ones you’d rather not carry.
Key Takeaways
- The S&P 500 UCITS has historically compounded faster, but with higher volatility and deep concentration in megacap tech.
- Euro Stoxx 50 UCITS provides euro stability, simpler taxation and a more traditional sector mix — at the cost of slower long-term growth.
- Domicile matters: Irish-domiciled S&P 500 UCITS ETFs benefit from a 15% US withholding tax rate; non-treaty domiciles may face 30%.
- Hedged share classes reduce currency swings but increase TER; the trade-off depends on the investor’s tolerance for FX noise.
- Acc vs. Dist share classes shape the investment experience as much as index choice — compounding vs. cash flow.
- Yield comparisons are misleading without adjusting for tax leakage.
- Real differences between the indices make diversification practical, not cosmetic.
- The “right answer” depends more on time horizon, income needs and tax residency than on past performance.
- For many Europeans, a blended approach ends up providing the most balanced risk profile.
- Portfolio behaviour — not headline returns — is what ultimately matters over decades.
FAQ: S&P 500 UCITS vs Euro Stoxx 50 for European Investors
Historically yes, but not for everyone. Its superior compounding comes with higher volatility and USD exposure. Some investors prefer the stability of euro-denominated returns.
Because the US–Ireland treaty reduces withholding tax on dividends to 15%. Over long periods, that difference materially improves net returns.
Lower tech exposure and euro-based pricing make it feel more stable, but the index is concentrated in just fifty companies. The risk profile is different — not necessarily lower.
Hedged share classes smooth out USD volatility but cost more. Long-term investors often accept the currency swings to avoid higher ongoing fees.
For most retail investors, yes. They lack the PRIIPs-compliant KID, so brokers restrict access. UCITS versions exist specifically for this reason.
Usually Euro Stoxx 50 UCITS, because payouts arrive in euros and taxation is simpler. But net yield still depends on fund domicile and treaty leakage.
It’s more concentrated than at any point in its history — the top ten companies account for roughly a third of the index. That boosts returns in good years and amplifies risk in bad ones.
Often yes. ECB policy directly influences eurozone corporates. But it also means the index reacts more sensitively to Europe’s slower growth cycles.
Absolutely. Many European investors combine them — S&P 500 for global growth, Euro Stoxx 50 for euro stability. It’s one of the simplest forms of regional diversification.
Comparing only past performance. Taxes, currency effects, domicile and share class choice often matter more to your long-term returns than a decade-long chart.
Iva Buće is a Master of Economics specializing in digital marketing and logistics. She combines analytical thinking with creativity to make financial and investment topics accessible to a broader audience. At Finorum, she focuses on translating complex economic concepts into clear, practical insights for everyday readers and investors.
Sources & References
EU regulations & taxation
- European Commission / Taxation & Customs — eurozone inflation
- FX can quietly rewrite a decade of results
- PRIIPs rules
- Irs.gov — US–Ireland treaty
- KPMG’s annual comparisons